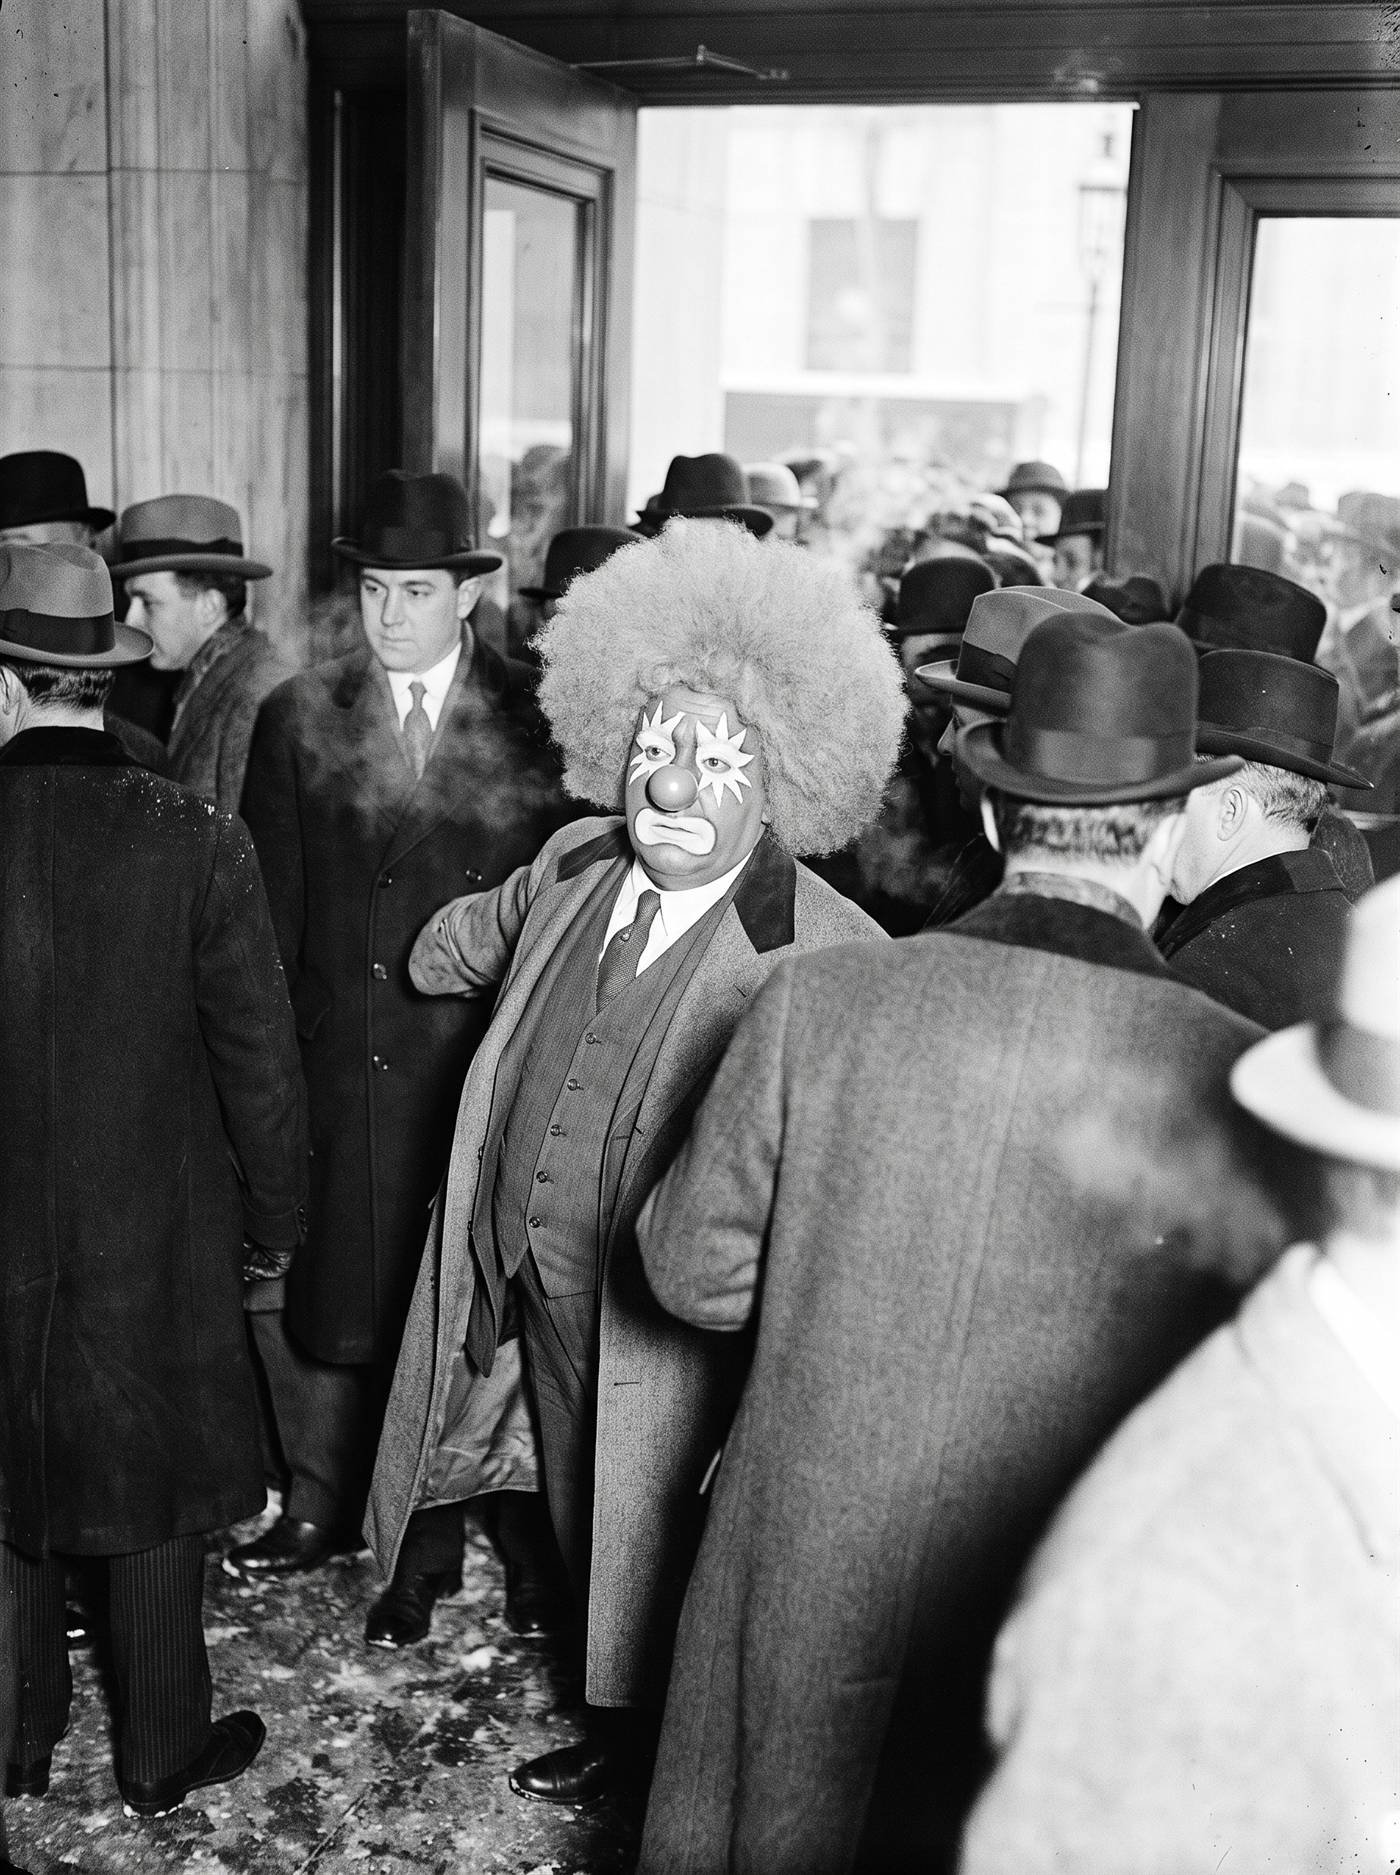
The worst day that never happened
DOW JONES 54.62 · +2.30 · +4.40% · the worst day in the tables, and a good one on the floor
The Exchange had been shut since the end of July and the world had gone to war in the meantime, so the reopening was expected to be a slaughter and was arranged carefully to prevent one. It was not a slaughter. Stocks came back with minimum prices in place, the selling that everyone had braced for did not materialize in the size that had been feared, and the market finished the session higher by four and four-tenths percent. Then, two years later, the average was rebuilt with twenty stocks instead of twelve and the new version was carried backwards only into December 1914 — leaving July on one basis and December on another, with nothing in between to reveal the seam. Measure across it and you get a fall of 24.39 percent. It has been at the top of the record ever since, and no one was there for it.
The day's protagonist
The seam — no symbol.
Move: −24.39% — measured across a joint, not across a day
On October 4, 1916 the Dow Jones Industrial Average was rebuilt from twelve stocks to twenty. To give the new version a usable past, its values were computed backwards into December 1914 — but no further, because the Exchange had been closed and there was nothing to compute across. The result is the single discontinuity in the index's history, and it falls precisely in the gap this archive has just crossed. The July 30 close survives on the twelve-stock basis as 71.42; the December 12 close survives on the twenty-stock basis in the low fifties. Set one against the other and the arithmetic returns a catastrophe. Measured properly, on either basis alone, the day is the same both ways: 71.42 to 74.56 on the old, 52.32 to 54.62 on the new — a rise of 4.40 percent, to the second decimal, twice. The two rulers disagree about length and agree exactly about the day.
The deeper account
The cross-check is what settles it. 74.56 divided by 71.42 is 1.04397. 54.62 divided by 52.3197 is 1.04397. Two entirely separate reconstructions of the same day, agreeing to five figures. A real fall of a quarter would have to appear in both, and it appears in neither.
This archive has now printed two days on which the number in general circulation is not the number the day produced. The first is its own opening page, where 40.94 and 31.58 are both correct for May 26, 1896. A basis is not a technicality; it is the difference between a record and a rumour.
The tables are not lying, exactly. They are quoting a series that genuinely contains that fall, because the series was assembled from two rulers laid end to end. What is wrong is the sentence people build on top of it — that this was a day on which American shareholders lost a quarter of everything.
For what it is worth, the reopening was reported at the time as a relief. The thing everyone had feared for four and a half months turned out, on the day, to be a rise.
The artifact
The Dow Jones Industrial Average was rebuilt from twelve stocks to twenty on October 4, 1916, and the new version was carried backwards only into December 1914 — no further, because there was nothing to carry it across. That leaves July 1914 written on one basis and December 1914 on another with a four-and-a-half-month blank between them and no seam visible in the printed series. Measured properly, within either column, this reopening is the same day twice: 71.42 to 74.56, and 52.32 to 54.62, both a rise of 4.40 percent to the second decimal, with the ratios agreeing to five figures. Measured across the columns it becomes a fall of 24.39 percent, which is where almost every published table of the Dow's worst days still begins. This sheet is the archive's own reconstruction of that arithmetic, not a surviving document.
Read the sheet
Printed text is shown plain; the statistician's note is shown in script.
RECONCILIATION OF THE AVERAGES · OLD BASIS AND NEW — drawn October 1916, for the session of December 12, 1914
- TWELVE STOCKS (the basis in use until 1916): July 30, 1914 — 71.42 · December 12, 1914 — 74.56 · +4.40%
- TWENTY STOCKS (back-calculated): July 30, 1914 — 52.32 · December 12, 1914 — 54.62 · +4.40%
- RATIO CHECK: 74.56 ÷ 71.42 = 1.04397 · 54.62 ÷ 52.32 = 1.04397
- THE TWO COLUMNS ARE DIFFERENT RULERS. DO NOT MEASURE FROM ONE INTO THE OTHER. 71.42 against 54.00 returns −24.39% and describes nothing that occurred.
- STATISTICIAN'S HAND: there is no bridge across the closure.
December 12, 1914 heads most published lists of the largest one-day percentage losses in the Dow's history at −24.39 percent. The New York Stock Exchange reopened for stocks that morning after a closure of a hundred and thirty-four days, with minimum prices in force, and the market rose. The apparent collapse is an artifact of the 1916 restatement — the only discontinuity in the index's history — and not an event.
The ledger — what actually happened
| Measure | Close | Change | Marginalia |
|---|---|---|---|
| Dow Jones | 54.62 | +2.30 · +4.40% | on the twenty-stock basis, measured from the last print of July 30 |
| On the old basis | 71.42 → 74.56 | the twelve-stock average as published; the same +4.40%, to the second decimal | |
| In the tables | −24.39% | the largest one-day loss in the index's recorded history, and an artifact of measuring across the 1916 restatement | |
| Closed since | July 30 | 134 days; bonds had resumed in a limited way in late November | |
| The reopening rule | minimum prices | stocks came back with floors under them, set by the Exchange |
Sources
- MeasuringWorth — Daily Closing Values of the Dow Jones Average (December 10–18, 1914, queried directly; the series resumes on December 12 at 54.62 after stopping on July 30 at 52.3197) — https://www.measuringworth.com/datasets/DJA/
- List of largest daily changes in the Dow Jones Industrial Average — where the −24.39% entry sits at the head of the table — https://en.wikipedia.org/wiki/List_of_largest_daily_changes_in_the_Dow_Jones_Industrial_Average
- The October 4, 1916 replacement of the twelve-stock average by a twenty-stock average, back-calculated into December 1914 — the only discontinuity in the index's history; the twelve-stock pair 71.42 → 74.56 for this day